LAST YEAR
NEXT WEEK
TOP
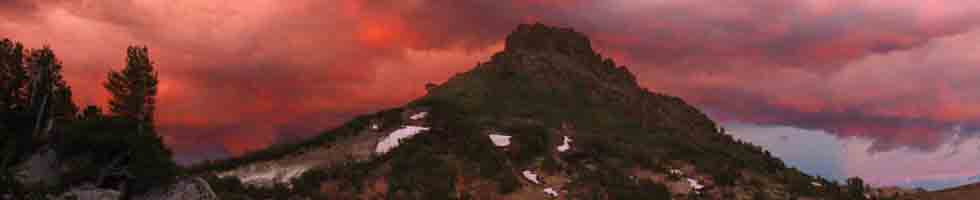
FULL WINTER CONDITIONS
2020
Be it a Winter Season of drought or deluge, The Fall Gear has been stowed or complimented by the Heavy Gear of Winter.
What's Going On?
2020
Fall to Winter Conditions
See 2020 High Sierra Reports
Full Fall Kit
September 27
Fall Winter Gear Required
November 2020
What's Going On?
2019
Fall to Winter Conditions
See 2019 High Sierra Reports
Full Fall Kit
September 27
Fall Winter Gear Required
November 2019
What's Going On?
2018
See December of 2017 High Sierra Reports
FALL
2017
to
WINTER
2018
On September 15th we shifted from Summer to Fall Gear.
On November 3rd Winter Gear was Required.
After November 26 FULL Winter gear, skills, and fitness levels required.
All
High Sierra Weather Info
Latest Daily Snow Depth Summary
Daily Sierra Snowpack % of Normal pdf
Daily Snow-Water & Percent of Average
All Precipitation-Snow Data
All Snow Surveys
SWC & Snow Depth
Yosemite-Hoover-Desolation
&
John Muir Trail Hikers:
Time to
Order Next Year's Permits!
Reserved permits for June 2018 now available from Yosemite, Hoover, and Desolation Wilderness Areas. In other words, Yosemite, Desolation, and Hoover Wilderness Areas all offer advanced reservations about six months ahead of your desired hiking dates.
This means now is the time to get your JMT permit application, along with other popular hikes, into the Man.
All Permits
Yosemite Permits Desolation Wilderness
|
31 DECEMBER 2019
CLOUDY & CLEAR
Temperate Day
LAST YEAR
NEXT WEEK
TOP
Warnings
NWS RENO
Special Statement
NWS SACTO
Special Statement
NWS HANFORD
Winter Watch
Warnings for Sunday
Point Forecasts
Lake Tahoe Forecast
Cherry Lake Forecast
Lee Vining Forecast
Lake Thomas Edison
Lake Isabella Forecast
CalTrans
2019 Jan
Snow Depth & Temps
2018 Jan
Snow Depth & Temps
2017 Jan
Snow Depth,
24 hour high & low temps
2016 Jan
January: Not Much
Compare Today
with
Snow
&
Temperatures
on
Dec 30
Dec 24
Dec 15 & 20
Dec 8 & 12
Dec 2 & 6
Nov 27
Nov 20
Nov 16
Nov 9
Nov 2
Oct 28
Oct 14
Sept 29
Sept 25
Aug 16th
2017 Jan
Snow Depth,
24 hour high & low temps |
1
CLOUDY & CLEAR
Temperate Day
Recent Winters
Jan 2015
Driest Year in History
Jan 2016
An Average-Dry Year
Jan 2017
Wettest Year in History
LAST YEAR
NEXT WEEK
TOP
Hiking the PCT
in
2020?
From the Trail Guide
The
Earliest, Latest, and Average Start Dates
How Will This Year Stack-Up?
ON THE CALENDAR
Earliest
Start Date
Winter of 2015
Driest in History
Average
Start Date
Winter of 2016
An Average-Dry Year
Latest
Start Date
Winter of 2017
Wettest in History
When are the trails along the Sierra Crest going to be passable this year?
Upcoming
Weather
Probabilities
These three years highlighted above offer the potential range of Weather Conditions within which this year's PCTer,
"Start Date," the date you can reasonably expect to encounter fairly snow-free trails with post-deadly fording conditions, will be determined within. These are the historic limits of wet and dry, with a perfectly average year thrown in-between, for good measure.
This date, of course, depends upon your ability to navigate snow at high altitude, along with your ability to cross the various stages of the dangerous thaw waters draining off it.
And your fitness, of course. You are training, are you not?
You can get through before and after the period of high-flow runoff, but not during this phase.
How the conditions of the Winter to Spring
Transition we track this year measures-up to the classic trajectories of these three years cited above will inform potential PCT hikers about the snow/trail conditions along the High Sierra Crest they may reasonably expect to encounter during May, June, and July of this year measure-up against those of the Driest year in history against an Average Year, against the wettest Year in History...
This year of 2020 will fit somewhere between these historic parameters of the record Wettest and record Driest years that happened between
2015 and 2017.
As our seasonal start date for open access to trails along the High Sierra Crest will be adjusted according to the character and trajectory of this year's Winter to Spring Transition, we will watch it carefully.
Advice for
Rookie Hikers wishing to hike the TYT-JMT-PCT
More
2018
Weather Notes
TWISTED SEASONS
Hottest & Driest, then Wettest Year Ever, over Three Years
Compare Years
This Week
TOP |
2
CLOUDY & CLEAR
Temperate Day
2020
Current Snowpack:
Percent of Average for
January 2.
N Sierra: 77%
−4% in 2 days.
Cen. Sierra: 90%
−4% in 2 days.
S Sierra: 104%
−5% in 2 days.
Ca State: 90%
−4% in 2 days.
Last Measurement:
Dec 31, 2019
Next Measurement:
Jan 6 & 9
2019-18
Statewide Summary of Snow Water Content PD
Station Reports
The
THIRD
--WINTER--
Temp-Snow
Check
January 2
2020
7 PM - 7 PM
Below: Watershed Snow Water Content Charts followed by individual reporting station's Snow Depth and 24 hour high-low temps.
Last Report:
Dec 30
Next Report:
Jan 8
Tahoe Basin
Watershed
Southwest Tahoe
Trail Map with Stations
PCT-TYT-TRT
Rubicon 31.0 −3.00
(10.60) + 0.10
7618 feet
Trail Map
41 & 31 +/+
PCT-TYT-TRT
Echo Peak 41.0 −2
(16.60) + 0.10
7652 feet
Stations Map
43 & 30 +/+
American-Yuba Watersheds
PCT-TYT
Carson Pass
45.0 −3
(13.70) +0.10
8388 feet
Trail Map
Stations Map
41 & 27 +/+
Carson-Walker
Watersheds
PCT-TYT
Ebbetts Pass
44.0 −4
(18.0) +0.10
8660 feet
Trail Map
41 & 27 +/+
West of PCT
Highlands Meadow
22.39 −1.62
(10.74) +0.3
8360 feet
Trail Map
38 & 27 +/+
EAST FLANK
Leavitt Lake
56.0 −2.0
(14.10) +0.1
9602 feet, East Flank
Trail Map
38
& 30 +/+
EAST FLANK
Marine Base
Cold Weather Training
6748 feet East Flank
Trail Map Above
FULL REPORT
VIS-CHIL-WEA-MB-
WIND
52 & 19 +/−
Mokelumne-Stanislaus Watersheds
PCT-TYT
Sonora Pass
Kennedy Meadows
RESUPPLY
Deadman Creek
22.86 −1.58
(--.--)
9250 feet,West Flank,
Trail Map
40 & 29 +/+
Tuolumne-Merced
Watersheds
SW of TYT
Horse Meadow
Error =0.4 ???
8602 feet
Trail Map
42 & 33 +/+
Top of List
Tenaya Lake
35.84 −2.86
(3.68) +0.06
8163 feet, West Flank
Trail Map
46 & 22 +/+
JMT-PCT-TYT
Tuolumne Meadows
27.14 −1.29
(3.23) +0.42
8600 feet, West Flank
Trail Map
46
& 17 +/=
Tioga Pass/Dana
ERROR +ERROR
(0.60) +0.13
9798 feet
Trail Map
39
& 28 +/+
Mammoth Mountain
Mono Lake-Owens Basin
East of PCT-JMT
Above Gem Lake
Gem Pass
(error)
10750 feet
Trail Map
temps bad
JMT-PCT Junction
Devils Postpile
29.52 −4.68
(7.67) =0.00
8004 feet
Trail Map Above
49 & 15 +/−
NE of JMT-PCT
Mammoth Pass
50.88 +0.53
(0.48) = ??
9500 feet
Trail Map
41 & 27 +/+
Top of List
JMT-PCT
E of Bear Ridge
Volcanic Knob
33.50 −2.5
(0.00) = ??
10100 feet
Trail Map
38 & 31 +/+
East Flank
South Lake Cabin
no snow sensor
(28.80) +0.1
9580 feet, East Flank
Trail Map
46 & 20 +/+
East Flank
Big Pine Sawmill
22.80 −2.8
10200 feet, East Flank
Trail Map Above
38 & 18 +/+
Kings River
Just East JMT-PCT
Bishop Pass (bad)
(0.0) =
11972 feet
Trail Map Above
-- & -- −/− (earlier)
Just West JMT-PCT
Charlotte Lake
37.10 −2.96
10398 feet, West Flank
Trail Map
40 & 16 +/=
(Typically the coldest station)
Kern Watershed
JMT-PCT
Upr Tyndall Creek
32.11 −3.73
11441 feet
Trail Map
38 & 24 +/+
JMT
Crabtree Meadow
5.08 −2.16 error ??
(32.43) +0.46
10,700 feet
Trail Map
41
& 24 +/+
? = questionable data
All High Sierra
Reporting Stations
More Stations, by Watersheds
Top of List
2018
2018
January 2
HIGH SIERRA
REPORT
What we're seeing today is one step in a transition between the last and the next in the series of vast, massive cells of persistant High Pressure air that have been covering the West Coast of California (if not the whole West Coast of North America) over the whole month of December. |
3
CLOUDY & CLEAR
Temperate Day
BEST
FORECASTS
HAZARDS
Precipitation
General
Quantitative Precipitation Forecasts:
ALL
RAIN FORECASTS
&
MODELS
Direct to
Seven Day Precip
Animation
Precipitation
Geographic
All High Sierra
ZONE & POINT
FORECASTS
All High Sierra
ZONE
FORECASTS
Now
RADAR
SATELLITES
Direct
to
GRAPHICAL INTERFACE
Forecast
Winds? Weather?
NorCal Graphics
Region, SW US
Forecast
Temperatures
Model
Five Day Mean
Low Temps
Click Green "Latest" Model,
observe using step button
All Temps
Let's look at the
Big Picture
Surface Map
The Pacific Ocean
US Weather Map
All Maps
This Week
TOP
2019
Persistant Blocking Ridge
Extended Clear Weather breaking today
2019
Current Snowpack:
Percent of Average for
January 3.
N Sierra: 62%
Cen. Sierra:68%
S Sierra: 70%
Ca State: 67%
2018
Pre-Storm
Current Snowpack:
Percent of Average for
January 3.
N Sierra: 21%
Cen. Sierra:29%
S Sierra: 20%
Ca State: 24%
2017 Jan
Today's Snow Depth,
24 hour high & low temp
This Week
TOP
This Week
TOP |
4
EARLY SHOWERS
Clearring into Cloudy
HHIGH SIERRA
SNOW INFO
All Snow Info
SNOW STATUS
&
FORECASTS
THE SNOWPACK
GRAPHICS
Date-Adjustable
High Sierra Snowpack Status
NOAA-NOHRSC
The High Sierra
1-2-20
Direct
to
Two Day
SNOW FORECAST
Seven Day Forecast
ALL PRECIP TOOLS
Mountain Safety
AVALANCHE DANGERS
Winter Backpacking
Considerations
Seven Day
Freezing Temperature Probability Model
LAST YEAR
NEXT WEEK
TOP
2019 Jan
Today's Snow Depth,
24 hour high & low temp
LAST YEAR
NEXT WEEK
TOP
LAST YEAR
NEXT WEEK
TOP
LAST YEAR
NEXT WEEK
TOP |
5
SWEET & CLEAR
Temperate Day
WARM
Spring-Like Day
Gonna Be A
COLD
Night
LAST WEEK
NEXT WEEK
TOP
2019
Snow Depth & Temps
2018
Snow Depth & Temps
2017
Snow Depth,
24 hour high & low temps |
6
SWEET & CLEAR
Temperate Day
2020
Current Snowpack:
Percent of Average for
January 6.
N Sierra: 73%
−4% in 4 days.
Cen. Sierra: 83%
−7% in 4 days.
S Sierra: 96%
−8% in 4 days.
Ca State: 83%
−7% in 4 days.
Last Measurement:
Jan 2
2019-18
Statewide Summary of Snow Water Content PD
Selected
Weather
Resources
Surface Low Pressure Tracks
Radar
Visible Satellites
Water Vapor Satellites
MAPS
Sierra Forecasts
Western US Forecasts
Precip Animation & Charts
Graphical Precip Forecast
All Sierra Snow Info
Sierra Sensor Networks
Watersheds and Selected Network of Crestline Sensors
High Sierra Highways
All Weather Information |
7
SWEET & CLEAR
Temperate Day
Late PM Showers
THE SNOWPACK
GRAPHICS
Date-Adjustable
High Sierra Snowpack Status
NOAA-NOHRSC
The High Sierra
1-7-20
2019
Current Snowpack:
Percent of Average for
January 7.
N Sierra: 79%
+17% in 4 days!!
Cen. Sierra:87%
+19% in 4 days!
S Sierra: 86%
+16% in 4 days!
Ca State: 84%
+17% in 4 days!
2017
Storm Time
Tropical Pounding
Rain on the Sierra Crest.
Ground Saturating, All Rivers Rising.
This Week
TOP
LAST WEEK
NEXT WEEK
TOP
This Week
TOP
This Week
TOP |
8
CLOUDY
Cooler Day
COOL
DayS
COLD
Nights
Warnings
NWS RENO
Winter Advisory
NWS SACTO
Winter Advisory
NWS HANFORD
No Warning
Advisories for Thursday
Station Reports
The
FOURTH
--WINTER--
Temp-Snow
Check
January 8
2020
7 PM - 7 PM
Below: Watershed Snow Water Content Charts followed by individual reporting station's Snow Depth and 24 hour high-low temps.
Last Report:
Jan 2
Next Report:
Jan 13
Tahoe Basin
Watershed
Southwest Tahoe
Trail Map with Stations
PCT-TYT-TRT
Rubicon 30.0 −1.00
(10.60) = 0.00
7618 feet
Trail Map
45 & 34 +/+
PCT-TYT-TRT
Echo Peak 41.0 =0
(16.40) − 0.20
7652 feet
Stations Map
45 & 34 +/+
American-Yuba Watersheds
PCT-TYT
Carson Pass
44.0 −1
(13.70) =0.00
8388 feet
Trail Map
Stations Map
31 & 21 −/−
Carson-Walker
Watersheds
PCT-TYT
Ebbetts Pass
44.0 = 0
(17.9)−0.10
8660 feet
Trail Map
42 & 30 +/+
West of PCT
Highlands Meadow
19.98 −2.41
(10.58) −0.16
8360 feet
Trail Map
29 & 18 −/−
EAST FLANK
Leavitt Lake
54.0 −2.0
(14.00) −0.1
9602 feet, East Flank
Trail Map
38
& 28 =/−
EAST FLANK
Marine Base
Cold Weather Training
6748 feet East Flank
Trail Map Above
FULL REPORT
VIS-CHIL-WEA-MB-
WIND
52 & 14 =/−
Mokelumne-Stanislaus Watersheds
PCT-TYT
Sonora Pass
Kennedy Meadows
RESUPPLY
Deadman Creek
23.16 +0.03
(--.--)
9250 feet,West Flank,
Trail Map
29 & 14 −/−
Tuolumne-Merced
Watersheds
SW of TYT
Horse Meadow
Error =0.4 ???
8602 feet
Trail Map
40 & 9 −/−
Top of List
Tenaya Lake
35.83 −0.01
(3.66) −0.02
8163 feet, West Flank
Trail Map
32 & 7 −/−
JMT-PCT-TYT
Tuolumne Meadows
26.33 −0.81
(3.23) =0.00
8600 feet, West Flank
Trail Map
33
& 6 −/−
Tioga Pass/Dana
ERROR +ERROR
(0.83) +0.23
9798 feet
Trail Map
27
& 9 −/−
Mammoth Mountain
Mono Lake-Owens Basin
East of PCT-JMT
Above Gem Lake
Gem Pass
(error)
10750 feet
Trail Map
temps bad
JMT-PCT Junction
Devils Postpile
26.12 −3.4
(7.67) =0.00
8004 feet
Trail Map Above
35 & 13 −/−
NE of JMT-PCT
Mammoth Pass
49.09 −1.79
(0.48) = ??
9500 feet
Trail Map
30 & 14 −/−
Top of List
JMT-PCT
E of Bear Ridge
Volcanic Knob
31.70 −1.8
(0.00) = ??
10100 feet
Trail Map
32 & 4 −/−
East Flank
South Lake Cabin
no snow sensor
(28.80) =0.0
9580 feet, East Flank
Trail Map
39 & 13 −/−
East Flank
Big Pine Sawmill
21.30 −1.5
10200 feet, East Flank
Trail Map Above
34 & 7 −/−
Kings River
Just East JMT-PCT
Bishop Pass (bad)
(0.0) =
11972 feet
Trail Map Above
-- & -- −/− (earlier)
Just West JMT-PCT
Charlotte Lake
34.62 −2.48
10398 feet, West Flank
Trail Map
27 & 3 −/−
(Typically the coldest station)
Kern Watershed
JMT-PCT
Upr Tyndall Creek
30.15 −1.96
11441 feet
Trail Map
28 & 10 −/−
JMT
Crabtree Meadow
3.77 −1.31 error ??
(32.73) +0.30
10,700 feet
Trail Map
34
& 6 −/−
? = questionable data
All High Sierra
Reporting Stations
More Stations, by Watersheds
Top of List |
9
CLOUDY
AM Showers
Cooler Day
2020
Current Snowpack:
Percent of Average for
January 9.
N Sierra: 71%
−2% in 3 days.
Cen. Sierra: 79%
−4% in 4 days.
S Sierra: 90%
−6% in 3 days.
Ca State: 78%
−5% in 3 days.
Next Measurement:
Jan 13
Statewide Summary of Snow Water Content PD
2019
Current Snowpack:
Percent of Average for
January 10.
N Sierra: 90%
+11% in 3 days!!
Cen. Sierra:89%
+2% in 3 days
S Sierra: 90%
+4% in 3 days
Ca State: 91%
+7% in 3 days
2018
Post-Storm
Current Snowpack:
Percent of Average for
January 10.
N Sierra: 18%
Cen. Sierra: 30%
S Sierra: 25%
Ca State: 26%
2017
Snow Depth,
24 hour high & low temps
2016
2015
REALTIME
High Sierra Crestline
Reporting Stations
WINTER 2020
Compare Today
with
Snow
&
Temperatures
on
Jan 2
Dec 30
Dec 24
Full Winter Report
LAST WEEK
NEXT WEEK
TOP |
10
CLOUDY
AM Showers
Cooler Day
Forecast
Temperatures
Direct to Model
Five Day Mean
Low Temps
Click Green "Latest" Model,
observe using step button
All Temps
On the Weather Page
Seven Day
Freezing Temperature Probability Model
Mountain Safety
AVALANCHE DANGERS
Winter Backpacking
Considerations
GEAR
All Temps
Snow Status
followed by
Snow Forecasts
Informative
"Normal" Vs. Now
Forcasts & Reality
vs.
Averages
REALTIME
High Sierra Crestline
Reporting Stations
FALL to WINTER
2019
Compare Today
with
Snow
&
Temperatures
on
Dec 15 & 20
Dec 8 & 12
Dec 2 & 6
Nov 27
Nov 20
Nov 16
Nov 9
Nov 2
Oct 28
Oct 14
Sept 29
Sept 25
Aug 16th
Full Winter Report
Stations
Rubicon
7618 feet
Echo Peak
7652 feet
Carson Pass
8388 feet
Ebbetts Pass
8660 feet
Leavitt Lake
9602 feet
Marine Base
6748 feet East Flank
Deadman Creek
9250 feet
Tuolumne Meadows
8600 feet
Tioga Pass/Dana
9798 feet
Gem Pass
10750 feet
Mammoth Pass
9500 feet
South Lake Cabin
9580 feet
Big Pine Sawmill
10200 feet
Bishop Pass
11972 feet
Charlotte Lake
10398 feet
Upr Tyndall Creek
11441 feet
All High Sierra
Reporting Stations
|
11
CLEAR
Cold
COLD
DayS
COLD
Nights
LAST WEEK
NEXT WEEK
TOP
BEST
FORECASTS
HAZARDS
Precipitation
General
Quantitative Precipitation Forecasts:
ALL
RAIN FORECASTS
&
MODELS
Direct to
Seven Day Precip
Animation
Precipitation
Geographic
All High Sierra
ZONE & POINT
FORECASTS
All High Sierra
ZONE
FORECASTS
Now
RADAR
SATELLITES
Direct
to
GRAPHICAL INTERFACE
Forecast
Winds? Weather?
NorCal Graphics
Region, SW US
Forecast
Temperatures
Model
Five Day Mean
Low Temps
Click Green "Latest" Model,
observe using step button
All Temps
Let's look at the
Big Picture
Surface Map
The Pacific Ocean
US Weather Map
All Maps
LAST WEEK
NEXT WEEK
TOP
LAST WEEK
NEXT WEEK
TOP |
12
CLOUDY
Cold
Warnings
NWS RENO
Winter Advisory
NWS SACTO
Winter Watch
NWS HANFORD
Winter Watch
COLD
DayS
COLD
Nights
Jan 12 2020
Pulsing
Weak Precip
PATTERN
Pulses of Weak Precip,
beginning late last week as a series of weak Lows began passing to the North of the Sierra, while being carried around the North flank of a big High that is still building into the center of the NE Pacific, continues....
High Times
The positioning of this High is determining the movement of the Lows and their associated Fronts, and if they impact the Sierra strongly or not.
The further West the High moves (in the NE Pacific), the more tendency the storms have of sliding down its East flank and across the Sierra.
The further East the High moves, the more the Sierra (and California generally), sits under the rain-shadow on the Eastern flank of the High, as the shape and movement of the High deflects Lows around the Sierra.
In one location this shape & movement directs storms around us, while in another it points them at us.
Problems in Paradise
It's when this High stays in one position for extended periods that problems, be they wet or dry problems, quickly build up.
BEST MAP
The Ridiculously Resilient Ridge
LAST WEEK
NEXT WEEK
TOP |
13
CLOUDY & CLEAR
Cold
Light AM Sprinkles
Warnings
NWS RENO
E Sierra Wind-Lake Wind
Winter Advisory
Monday-Tuesday,
Wendesday-Thursday
NWS SACTO
Winter Advisory
Tonight thru Thursday
NWS HANFORD
Winter Watch
Wednesday-Thursday
COOL
DayS
COLD
Nights
2020
Current Snowpack:
Percent of Average for
January 13.
N Sierra: 70%
−1% in 4 days.
Cen. Sierra: 75%
−4% in 4 days.
S Sierra: 83%
−7% in 4 days.
Ca State: 75%
−3% in 4 days.
Last Measurements:
Jan 6 & 9
Statewide Summary of Snow Water Content PD
Station Reports
The
FIFTH
--WINTER--
Temp-Snow
Check
January 13
2020
4 PM - 4 PM
Below: Watershed Snow Water Content Charts followed by individual reporting station's Snow Depth and 24 hour high-low temps.
Last Report:
Jan 8
Next Report:
Jan 17 --->
Tahoe Basin
Watershed
Southwest Tahoe
Trail Map with Stations
PCT-TYT-TRT
Rubicon 30.0 =0.00
(10.70) + 0.10
7618 feet
Trail Map
35 & 24 −/−
PCT-TYT-TRT
Echo Peak 41.0 =0
(16.70) + 0.30
7652 feet
Stations Map
35 & 22 −/−
American-Yuba Watersheds
PCT-TYT
Carson Pass
43.0 −1
(13.80) + 0.10
8388 feet
Trail Map
Stations Map
35 & 18 +/−
Carson-Walker
Watersheds
PCT-TYT
Ebbetts Pass
41.0 −3.0
(18.1) + 0.20
8660 feet
Trail Map
33 & 18 −/−
West of PCT
Highlands Meadow
19.74 −0.24
(10.84) +0.26
8360 feet
Trail Map
29 & 13 =/−
Top of List
EAST FLANK
Leavitt Lake
55.0 +1.0
(14.30) +0.30
9602 feet, East Flank
Trail Map
29
& 19 −/−
EAST FLANK
Marine Base
Cold Weather Training
6748 feet East Flank
Trail Map Above
FULL REPORT
VIS-CHIL-WEA-MB-
WIND
48 & 18 −/+
Mokelumne-Stanislaus Watersheds
PCT-TYT
Sonora Pass
Kennedy Meadows
RESUPPLY
Deadman Creek
23.39 +0.23
(--.--)
9250 feet,West Flank,
Trail Map
31 & 11 +/−
Tuolumne-Merced
Watersheds
SW of TYT
Horse Meadow
Error =0.4 ???
8602 feet
Trail Map
31 & −1 −/−
Top of List
Tenaya Lake
33.41 −2.42
(3.69) +0.03
8163 feet, West Flank
Trail Map
36 & 1 +/−
JMT-PCT-TYT
Tuolumne Meadows
25.74 −0.59
(3.25) +0.02
8600 feet, West Flank
Trail Map
39
& 0 +/−
Tioga Pass/Dana
ERROR +ERROR
(0.90) +0.17
9798 feet
Trail Map
33
& 12 +/+
Mammoth Mountain
Mono Lake-Owens Basin
East of PCT-JMT
Above Gem Lake
Gem Pass
(error)
10750 feet
Trail Map
temps bad
JMT-PCT Junction
Devils Postpile
25.29 −0.83
(7.69) +0.02
8004 feet
Trail Map Above
38 & 7 +/−
NE of JMT-PCT
Mammoth Pass
48.29 −0.8
(0.48) = ??
9500 feet
Trail Map
34 & 15 +/+
Top of List
JMT-PCT
E of Bear Ridge
Volcanic Knob
31.50 −0.2
(0.00) = ??
10100 feet
Trail Map
40 & 10 +/+
East Flank
South Lake Cabin
no snow sensor
(28.80) =0.0
9580 feet, East Flank
Trail Map
46 & 23 +/+
East Flank
Big Pine Sawmill
20.70 −0.6
10200 feet, East Flank
Trail Map Above
38 & 19 +/+
Kings River
Just East JMT-PCT
Bishop Pass (bad)
(0.0) =
11972 feet
Trail Map Above
-- & -- −/− (earlier)
Just West JMT-PCT
Charlotte Lake
33.83 −0.79
10398 feet, West Flank
Trail Map
35 & 6 +/+
(Typically the coldest station)
Kern Watershed
JMT-PCT
Upr Tyndall Creek
29.67 −0.48
11441 feet
Trail Map
33 & 15 +/+
JMT
Crabtree Meadow
X.XX −X.XX error !
(32.84) +0.11
10,700 feet
Trail Map
37
& 13 +/+
? = questionable data
All High Sierra
Reporting Stations
More Stations, by Watersheds
Top of List
|
14
CLOUDY
AM Showers
Point Forecast
Walker Forecast
Great Trip
COOL
DayS
COLD
Nights
Forecast
Temperatures
Direct to Model
Five Day Mean
Low Temps
Click Green "Latest" Model,
observe using step button
Direct to Model
Seven Day
Freezing Temperature
Probability Model
All Temps
The Weather Page
REALTIME
High Sierra Crestline
Reporting Stations
WINTER 2020
Fall to Winter
Compare Today
with
Snow
&
Temperatures
on
Jan 8
Jan 2
Dec 30
Dec 24
2019, 14th
Snow Depth & Temps
2018, 14th
Snow Depth & Temps
2017
Snow Depth,
24 hour high & low temp |
15
CLOUDY & CLEAR
Bigger Front Coming...
Warnings
NWS RENO
Winter Storm Warning
Avalanche Watch
Thursday-Friday
NWS SACTO
Winter Storm Warning
Tonight thru Friday
NWS HANFORD
Winter Storm Warning
Thursday-Friday
COOL
DayS
COLD
Nights
LAST WEEK
NEXT WEEK
TOP
2020
Current Snowpack:
Percent of Average for
January 15.
N Sierra: 74%
+4% in 2 days.
Cen. Sierra: 75%
=% in 2 days.
S Sierra: 80%
−3% in 2 days.
Ca State: 76%
+1% in 2 days.
Informative
"Normal" Vs. Now
Forcasts & Reality
vs.
Averages
2019
MANY
WARNINGS
WINTER STORM
BLIZZARD WARNING!!
CALENDAR
WINTER STORM WARNINGS
Fire Zone
FLASH FLOOD WARNING
YOS VALLEY
FLOOD WARNING
WIND WARNINGS
Up & Down Sierra
Any semblance of a High Pressure blocking ridge has been shattered...
This Week
TOP
This Week
TOP
This Week
TOP |
16
STRONG FRONT
Heavy Precip
Warnings
NWS RENO
Winter Storm Warning
Avalanche Watch
Thursday-Friday
NWS SACTO
Winter Storm Warning
Tonight thru Friday
NWS HANFORD
Winter Storm Warning
Thursday-Friday
CalTrans
Point
Forecasts
Lake Tahoe Forecast
Walker Forecast
Sonora Pass Forecast
Cherry Lake Forecast
Lee Vining Forecast
Tuolumne Meadows
Mammoth Pass
Lake Thomas Edison
Lake Isabella Forecast
Move the Map Dot
to
Customize Forecast Point
Trail Maps
PCT-JMT-TWT
2020?
Considering Access
2019
Current Snowpack:
Percent of Average for
January 16.
N Sierra: 91%
+1% in 6 days
Cen. Sierra:90%
+1% in 6 days
S Sierra: 87%
-3% in 6 days
Ca State: 90%
-1% in 6 days
This Week
TOP |
17
CLEARING
Cold
COLD
DayS
COLD
Nights
Forecast Links Below
2020
Current Snowpack:
Percent of Average for
January 17.
N Sierra: 83%
+9% in 2 days.
Cen. Sierra: 78%
+3% in 2 days.
S Sierra: 81%
+1% in 2 days.
Ca State: 82%
+6% in 2 days.
Next Measurement:
Jan 23
Statewide Summary of Snow Water Content PD
Station Reports
The
SIXTH
--WINTER--
Temp-Snow
Check
January 17
2020
9 AM - 9 AM
Below: Watershed Snow Water Content Charts followed by individual reporting station's Snow Depth and 24 hour high-low temps.
Last Report:
Jan 13
Next Report:
Jan 23 2020
Tahoe Basin
Watershed
Southwest Tahoe
Trail Map with Stations
PCT-TYT-TRT
Rubicon 46.0 +16.00
(12.10) +1.40
7618 feet
Trail Map
31 & 17 −/−
PCT-TYT-TRT
Echo Peak 56.0 +15
(19.00) + 2.30
7652 feet
Stations Map
31 & 17 −/−
American-Yuba Watersheds
PCT-TYT
Carson Pass
52.0 +9
(14.50) + 0.70
8388 feet
Trail Map
Stations Map
28 & 12 −/−
Carson-Walker
Watersheds
PCT-TYT
Ebbetts Pass
56.0 +15
(19.4) + 1.30
8660 feet
Trail Map
28 & 14 −/−
West of PCT
Highlands Meadow
19.33 −0.41 ??
(11.02) +0.18 ??
8360 feet
Trail Map
26 & 9 −/−
Top of List
EAST FLANK
Leavitt Lake
70.0 +15.0
(15.10) +0.80
9602 feet, East Flank
Trail Map
29
& 11 =/−
EAST FLANK
Marine Base
Cold Weather Training
6748 feet East Flank
Trail Map Above
FULL REPORT
VIS-CHIL-WEA-MB-
WIND
40 & 19 −/+
Mokelumne-Stanislaus Watersheds
PCT-TYT
Sonora Pass
Kennedy Meadows
RESUPPLY
Deadman Creek
22.35 −0.04
(--.--)
9250 feet,West Flank,
Trail Map
25 & 6 −/−
Tuolumne-Merced
Watersheds
SW of TYT
Horse Meadow
Error =0.4 ???
8602 feet
Trail Map
27 & −3 −/−
Top of List
Tenaya Lake
41.89 +8.48
(3.73) +0.04 ??
8163 feet, West Flank
Trail Map
30 & 0 −/−
JMT-PCT-TYT
Tuolumne Meadows
36.18 +10.44
(3.25) +0.02
8600 feet, West Flank
Trail Map
29
& −2 −/−
Tioga Pass/Dana
ERROR +ERROR
(0.91) +0.01 ??
9798 feet
Trail Map
23
& 2 −/−
Mammoth Mountain
Mono Lake-Owens Basin
East of PCT-JMT
Above Gem Lake
Gem Pass
(error)
10750 feet
Trail Map
temps bad
JMT-PCT Junction
Devils Postpile
36.39 +11.10
(8.28) +0.59
8004 feet
Trail Map Above
33 & 5 −/−
NE of JMT-PCT
Mammoth Pass
55.34 +7.05
(0.48) = ??
9500 feet
Trail Map
24 & 7 −/−
Top of List
JMT-PCT
E of Bear Ridge
Volcanic Knob
44.40 +12.9
(0.00) = ??
10100 feet
Trail Map
25 & 0 −/−
East Flank
South Lake Cabin
no snow sensor
(28.90) +0.1 ??
9580 feet, East Flank
Trail Map
26 & 10 −/−
East Flank
Big Pine Sawmill
25.30 +4.6
10200 feet, East Flank
Trail Map Above
23 & 8 −/−
Kings River
Just East JMT-PCT
Bishop Pass (bad)
(0.0) =
11972 feet
Trail Map Above
-- & -- −/− (earlier)
Just West JMT-PCT
Charlotte Lake
43.99 +10.16
10398 feet, West Flank
Trail Map
30 & −4 −/−
(Typically the coldest station)
Kern Watershed
JMT-PCT
Upr Tyndall Creek
36.42 +6.75
11441 feet
Trail Map
24 & −7 −/−
JMT
Crabtree Meadow
X.XX −X.XX error !
(31.94) −0.9 ??
10,700 feet
Trail Map
26 & −1 −/−
? = questionable data
All High Sierra
Reporting Stations
More Stations, by Watersheds
Top of List |
18
GLOOMY
Cloudy-Warmer
LAST WEEK
NEXT WEEK
TOP
MODIS SIERRA VIEW
All California Webcams
Cams: Layers, Select.
Mountain Safety
AVALANCHE DANGERS
Winter Backpacking
Considerations
SNOW INFO
All Snow Info
SNOW STATUS
&
FORECASTS
SNOW
FORECASTS
Direct
to
Two Day
SNOW FORECAST
Seven Day Forecast
ALL PRECIP TOOLS
THE SNOWPACK
Snow Status
GRAPHICS
Snow Status
Date-Adjustable
High Sierra Snowpack Status
Snow Status
NOAA-NOHRSC
The High Sierra
1-13-20
LAST WEEK
NEXT WEEK
TOP
2019
Current Snowpack:
Percent of Average for
January 18.
N Sierra: 113%
+22% in 3 days!!
Cen Sierra:110%
+20% in 3 days!
S Sierra: 110%
+23% in 3 days!
Ca State: 111%
+21% in 3 days!
2018 & 2017
on the 20th
LAST WEEK
NEXT WEEK
TOP
LAST WEEK
NEXT WEEK
TOP
LAST WEEK
NEXT WEEK
TOP
LAST WEEK
NEXT WEEK
TOP |
19
GLOOMY
Cloudy-Warmer
LAST WEEK
NEXT WEEK
TOP
2019
Snow Depth & Temps
2018
Snow Depth & Temps
2017
Snow Depth,
24 hour high & low temps |
20
MARTIN LUTHER KING
DAY
GLOOMY
Cloudy-Cool
Warnings
NWS RENO
Special Statement
Passes Tuesday
NWS SACTO
Special Statement
Tonight thru Early Wed
NWS HANFORD
NADA
----
2018
Snowpack:
Percent of Average for
January 20.
N Sierra: 17%
Cen. Sierra: 27%
S Sierra: 21%
Ca State: 22%
Last: Jan 3, 2018
2018
2017
Snowpack:
Percent of Average for
January 20.
N Sierra: 143%
Cen. Sierra:168%
S Sierra: 197%
Ca State: 168%
2017
|
21
MODERATE FRONT
Moderate Precip
BEST
FORECASTS
HAZARDS
Precipitation
General
Quantitative Precipitation Forecasts:
ALL
RAIN FORECASTS
&
MODELS
Direct to
Seven Day Precip
Animation
Precipitation
Geographic
All High Sierra
ZONE & POINT
FORECASTS
All High Sierra
ZONE
FORECASTS
Now
RADAR
SATELLITES
Direct
to
GRAPHICAL INTERFACE
Forecast
Winds? Weather?
NorCal Graphics
Region, SW US
Forecast
Temperatures
Model
Five Day Mean
Low Temps
Click Green "Latest" Model,
observe using step button
All Temps
Let's look at the
Big Picture
Surface Map
The Pacific Ocean
US Weather Map
All Maps |
22
CLOUDY
Diminished Showers, Warm
Point
Forecasts
Lake Tahoe Forecast
Walker Forecast
Sonora Pass Forecast
Cherry Lake Forecast
Lee Vining Forecast
Tuolumne Meadows
Mammoth Pass
Lake Thomas Edison
Lake Isabella Forecast
Move the Map Dot
to
Customize Forecast Point
Trail Maps
Eyes
MODIS SIERRA VIEW
All California Webcams
Cams: Layers, Select.
|
23
CLOUDY
Warmer
2020
Current Snowpack:
Percent of Average for
January 23.
N Sierra: 81%
−2% in 6 days.
Cen. Sierra: 73%
−5% in 6 days.
S Sierra: 85%
−6% in 6 days.
Ca State: 76%
−6% in 6 days.
Last Measurement:
Jan 17
Next Measurement:
Jan 27
Statewide Summary of Snow Water Content PD
SNOW INFO
All Snow Info
SNOW STATUS
&
FORECASTS
SNOW
FORECASTS
Direct
to
Two Day
SNOW FORECAST
Seven Day Forecast
ALL PRECIP TOOLS
2018
Weather Notes
TWISTED SEASONS
Hottest & Driest, then Wettest Year Ever, over Three Years
Compare Years
Station Reports
The
SEVENTH
--WINTER--
Temp-Snow
Check
January 23
2020
12 NOON - 12 NOON
Below: Watershed Snow Water Content Charts followed by individual reporting station's Snow Depth and 24 hour high-low temps.
Last Report:
Jan 17
Next Report:
Jan 28
Tahoe Basin
Watershed
Southwest Tahoe
Trail Map with Stations
PCT-TYT-TRT
Rubicon 37.0 −9.00
(12.40) +0.30
7618 feet
Trail Map
43 & 33 +/+
PCT-TYT-TRT
Echo Peak 50.0 −6
(19.70) + 0.70
7652 feet
Stations Map
46 & 33 +/+
American-Yuba Watersheds
PCT-TYT
Carson Pass
46.0 −6
(14.80) + 0.30
8388 feet
Trail Map
Stations Map
43 & 26 +/+
Carson-Walker
Watersheds
PCT-TYT
Ebbetts Pass
48.0 −8
(19.8) +0.40
8660 feet
Trail Map
46 & 31 +/+
West of PCT
Highlands Meadow
17.98 −1.35
(11.96) +0.94
8360 feet
Trail Map
42 & 20 +/+
Top of List
EAST FLANK
Leavitt Lake
61.0 −9.0
(15.50) +0.40
9602 feet, East Flank
Trail Map
43
& 29 +/+
EAST FLANK
Marine Base
Cold Weather Training
6748 feet East Flank
Trail Map Above
FULL REPORT
VIS-CHIL-WEA-MB-
WIND
51 & 24 +/+
Mokelumne-Stanislaus Watersheds
PCT-TYT
Sonora Pass
Kennedy Meadows
RESUPPLY
Deadman Creek
27.15 +4.8
(--.--)
9250 feet,West Flank,
Trail Map
44 & 17 +/+
Tuolumne-Merced
Watersheds
SW of TYT
Horse Meadow
Error =0.4 ???
8602 feet
Trail Map
48 & 9 +/+
Top of List
Tenaya Lake
40.57 −0.34
(4.07) =0.00
8163 feet, West Flank
Trail Map
48 & 14 +/+
JMT-PCT-TYT
Tuolumne Meadows
30.10 −6.08
(3.66) +0.41
8600 feet, West Flank
Trail Map
50
& 8 +/+
Tioga Pass/Dana
ERROR +ERROR
(1.23) +0.32 ??
9798 feet
Trail Map
42
& 15 +/+
Mammoth Mountain
Mono Lake-Owens Basin
East of PCT-JMT
Above Gem Lake
Gem Pass
(error)
10750 feet
Trail Map
temps bad
JMT-PCT Junction
Devils Postpile
29.54 −6.85
(8.43) +0.15
8004 feet
Trail Map Above
49 & 15 +/+
NE of JMT-PCT
Mammoth Pass
51.35 −3.99
(0.48) = ??
9500 feet
Trail Map
44 & 23 +/+
Top of List
JMT-PCT
E of Bear Ridge
Volcanic Knob
39.60 −4.8
(0.00) = ??
10100 feet
Trail Map
51 & 15 +/+
East Flank
South Lake Cabin
no snow sensor
(28.90) =0.0
9580 feet, East Flank
Trail Map
48 & 16 +/+
East Flank
Big Pine Sawmill
21.20 −4.1
10200 feet, East Flank
Trail Map Above
42 & 13 +/+
Kings River
Just East JMT-PCT
Bishop Pass (bad)
(0.0) =
11972 feet
Trail Map Above
-- & -- −/− (earlier)
Just West JMT-PCT
Charlotte Lake
43.03 −0.96
10398 feet, West Flank
Trail Map
34 & 21 +/+
(Typically the coldest station) WRONG DATE
Kern Watershed
JMT-PCT
Upr Tyndall Creek
34.39 −2.03
11441 feet
Trail Map
42 & 19 +/+
JMT
Crabtree Meadow
X.XX −X.XX error !
(33.13) +1.19
10,700 feet
Trail Map
41 & 16 +/+
? = questionable data
All High Sierra
Reporting Stations
More Stations, by Watersheds
Top of List
|
24
CLOUDY & SUN
Warmer
CalTrans
2019
Current Snowpack:
Percent of Average for
January 24.
N Sierra: 111%
-2% in 6 days!!
Cen. Sierra:113%
+3% in 6 days!
S Sierra: 108%
-2% in 6 days!
Ca State: 111%
No change in 6 days!
2019
This Week
TOP
REALTIME
High Sierra Crestline
Reporting Stations
WINTER 2020
Fall to Winter
Compare Today
with
Snow
&
Temperatures
on
Jan 13 & 17
Jan 8
Jan 2
Dec 30
Dec 24
Full Winter Report
This Week
TOP
This Week
TOP
This Week
TOP |
25
LIGHT SHOWERS
Early-AM
LAST WEEK
NEXT WEEK
TOP
Informative
"Normal" Vs. Now
Forcasts & Reality
vs.
Averages
LAST WEEK
NEXT WEEK
TOP
LAST WEEK
NEXT WEEK
TOP
LAST WEEK
NEXT WEEK
TOP
|
26
CLOUDY & CLEAR
Spots
LAST WEEK
NEXT MONTH
TOP
2019
Snow Depth & Temps
2018
Snow Depth & Temps
2017
Snow Depth,
24 hour high & low temps
2018
Snowpack:
Percent of Average for
January 26.
(Change since Jan 20.)
N Sierra: 27%
(+10%)
Cen. Sierra: 35%
(+7%)
S Sierra: 24%
(+3%)
Ca State: 30%
(+8%)
2018
|
27
LIGHT SHOWERS
Mid-PM
2020
Current Snowpack:
Percent of Average for
January 27.
N Sierra: 79%
−2% in 4 days.
Cen. Sierra: 74%
+1% in 4 days.
S Sierra: 70%
−15% in 4 days.
Ca State: 75%
−1% in 4 days.
Last Measurement:
Jan 23
Next Measurement:
Feb 3
THE SNOWPACK
Snow Status
GRAPHICS
Snow Status
Date-Adjustable
High Sierra Snowpack Status
Snow Status
NOAA-NOHRSC
The High Sierra
1-28-20
All Snow
More Snow:
This Week
TOP
REALTIME
High Sierra Crestline
Reporting Stations
WINTER 2020
Fall to Winter
Compare Today
with
Snow
&
Temperatures
on
Jan 23
Jan 13 & 17
Jan 8
Jan 2
Dec 30
Dec 24
Full Winter Report |
28
LIGHT SHOWERS
Weak but Cooler
Pattern Note
COOL
DayS
COLD
Nights
2019
Current Snowpack:
Percent of Average for
January 28.
N Sierra: 106%
-5% in 4 days!!
Cen. Sierra:106%
-7% in 4 days!
S Sierra: 101%
-7% in 4 days!
Ca State: 105%
-6% in 4 days!
Last Reading
January 24
Statewide Summary of Snow Water Content PDF 2019
2017, 28th
Clear Blue Skies,
High off CA Coast
2016
Sierra approaching season-normal snow and precip for first time in years.
Station Reports
The
EIGHTH
--WINTER--
Temp-Snow
Check
January 28
2020
11 AM - 11 PM
Below: Watershed Snow Water Content Charts followed by individual reporting station's Snow Depth and 24 hour high-low temps.
Last Report:
Jan 23
Next Report:
Jan 2020-
Tahoe Basin
Watershed
Southwest Tahoe
Trail Map with Stations
PCT-TYT-TRT
Rubicon 36.0 −1.00
(13.20) +0.80
7618 feet
Trail Map
36 & 30 −/−
PCT-TYT-TRT
Echo Peak 51.0 +1
(20.20) + 1.20
7652 feet
Stations Map
38 & 30 −/−
American-Yuba Watersheds
PCT-TYT
Carson Pass
47.0 +1
(15.10) + 0.30
8388 feet
Trail Map
Stations Map
35 & 20 −/−
Carson-Walker
Watersheds
PCT-TYT
Ebbetts Pass
51.0 +3
(20.5) +0.70
8660 feet
Trail Map
36 & 28 −/−
West of PCT
Highlands Meadow
19.28 +1.30
(12.36) +0.40
8360 feet
Trail Map
30 & 16 −/−
Top of List
EAST FLANK
Leavitt Lake
65.0 +4.0
(16.00) +0.50
9602 feet, East Flank
Trail Map
35
& 28 −/−
EAST FLANK
Marine Base
Cold Weather Training
6748 feet East Flank
Trail Map Above
FULL REPORT
VIS-CHIL-WEA-MB-
WIND
49 & 23 −/−
Mokelumne-Stanislaus Watersheds
PCT-TYT
Sonora Pass
Kennedy Meadows
RESUPPLY
Deadman Creek
29.74 +2.59
(--.--)
9250 feet,West Flank,
Trail Map
34 & 19 −/+
Tuolumne-Merced
Watersheds
SW of TYT
Horse Meadow
Error =0.4 ???
8602 feet
Trail Map
42 & 6 −/−
Top of List
Tenaya Lake
40.43 −0.14
(4.59) +0.52
8163 feet, West Flank
Trail Map
39 & 8 −/−
JMT-PCT-TYT
Tuolumne Meadows
30.10 +0.72
(4.02) +0.36
8600 feet, West Flank
Trail Map
39
& 5 −/−
Tioga Pass/Dana
ERROR +ERROR
(1.36) +0.13 ??
9798 feet
Trail Map
33
& 13 −/−
Mammoth Mountain
Mono Lake-Owens Basin
East of PCT-JMT
Above Gem Lake
Gem Pass
(error)
10750 feet
Trail Map
temps bad
JMT-PCT Junction
Devils Postpile
27.10 −2.44
(8.43) +0.21
8004 feet
Trail Map Above
30 & 12 −/−
NE of JMT-PCT
Mammoth Pass
51.65 +0.30
(0.48) = ??
9500 feet
Trail Map
40 & 22 −/−
Top of List
JMT-PCT
E of Bear Ridge
Volcanic Knob
39.40 −0.2
(0.00) = ??
10100 feet
Trail Map
42 & 14 −/−
East Flank
South Lake Cabin
no snow sensor
(28.90) =0.0
9580 feet, East Flank
Trail Map
48 & 21 =/+
East Flank
Big Pine Sawmill
20.30 −0.9
10200 feet, East Flank
Trail Map Above
40 & 17 −/+
Kings River
Just East JMT-PCT
Bishop Pass (bad)
(0.0) =
11972 feet
Trail Map Above
-- & -- −/− (earlier)
Just West JMT-PCT
Charlotte Lake
43.03 −ERROR-
10398 feet, West Flank
Trail Map
35 & 11 +/−
(Typically the coldest station) WRONG DATE
Kern Watershed
JMT-PCT
Upr Tyndall Creek
34.24 −0.15
11441 feet
Trail Map
33 & 20 −/+
JMT
Crabtree Meadow
X.XX −X.XX error !
(33.20) +0.07
10,700 feet
Trail Map
38 & 15 −/−
? = questionable data
All High Sierra
Reporting Stations
More Stations, by Watersheds
Top of List |
29
CLOUDY & SUN
Warmer
Warming...
COOL
DayS
COLD
Nights
Spring-"ish"
BEST
FORECASTS
HAZARDS
Precipitation
General
Quantitative Precipitation Forecasts:
ALL
RAIN FORECASTS
&
MODELS
Direct to
Seven Day Precip
Animation
Precipitation
Geographic
All High Sierra
ZONE & POINT
FORECASTS
All High Sierra
ZONE
FORECASTS
Now
RADAR
SATELLITES
Direct
to
GRAPHICAL INTERFACE
Forecast
Winds? Weather?
NorCal Graphics
Region, SW US
Forecast
Temperatures
Model
Five Day Mean
Low Temps
Click Green "Latest" Model,
observe using step button
All Temps
Let's look at the
Big Picture
Surface Map
The Pacific Ocean
US Weather Map
All Maps
|
30
CLOUDY
&
CLEARING
Warmer
Point
Forecasts
Lake Tahoe Forecast
Walker Forecast
Sonora Pass Forecast
Cherry Lake Forecast
Lee Vining Forecast
Tuolumne Meadows
Mammoth Pass
Lake Thomas Edison
Lake Isabella Forecast
Move the Map Dot
to
Customize Forecast Point
Trail Maps
This Week
TOP
This Week
TOP
This Week
TOP |
31
SNOW
FORECASTS
Direct
to
Two Day
SNOW FORECAST
Seven Day Forecast
ALL PRECIP TOOLS
!!
SEASON-NORMAL SNOW
2019
Current Snowpack:
Percent of Average for
January 31.
N Sierra: 100%
-6% in 3 days!!
Cen. Sierra:102%
-4% in 3 days!
S Sierra: 97%
-4% in 3 days!
Ca State: 100%
-5% in 3 days!
2019
2018
Snowpack:
Percent of Average for
January 31.
(Change since Jan 26.)
N Sierra: 29%
(+2%)
Cen. Sierra: 35%
(+0%)
S Sierra: 21%
(-3%)
Ca State: 30%
(+0%)
2018: Note Minimal Snow
2017: Note Massive Snow
& Low Temps!!
See Feb 3, 2017 Snow |
1 FEBRUARY 2020
CLOUDY
&
CLEARING
Windy-Cool
LAST WEEK
NEXT MONTH
TOP
February 2015
Driest Year in History
February 2016
An Average Year
February 2017
Wettest Year in History
2018
Weather Notes
TWISTED SEASONS
Hottest & Driest, then Wettest Year Ever, over Three Years
Compare Years
Advice for
Rookie Hikers wishing to hike the TYT-JMT-PCT
PCT HIKER NOTES
Above
LAST WEEK
NEXT MONTH
TOP
LAST WEEK
NEXT MONTH
TOP
LAST WEEK
NEXT MONTH
TOP
LAST WEEK
NEXT MONTH
TOP
|